I’ll Take Your Numbers, and Raise You by a Format and a Graph
![]()
Marketing Analytics—Why visuals are your best friend ever
Here I am, coming into week four of a football pool. I’ve been close to the bottom every week (not the bottom, just close…alright practically bottom) and I can’t figure out why I can’t even be mid-pack.
I can speak Excel, and I can speak football, so I said to Self, “Self, why don’t we use data to win.” And Self replied,”Heck yeah!”
Do you know what happened that week? I nearly won. I was third and missed by three points (thanks a lot, Eagles).
Numbers Tell the Truth, But They Cannot Speak for Themselves
While hunches make us human, we cannot forget one simple fact: Numbers. Don’t. Lie. They can’t, they don’t know how to, they just know what you put in will kick something out.
But numbers don’t speak words, and that is why they have friends called graphs. Graphs speak for the numbers, and if graphs cannot, then conditional formatting is there to lend a helping hand. Let me show a picture because I can feel my nerdiness oozing.
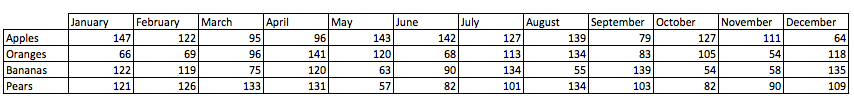
Let’s say I gave you the following charts, and I said numbers are good if they are over 78, and I asked, “What is typically the best performing fruit?” Oh, and you have seconds to answer because I’m super busy.
Numbers says this:
“I don’t know. Figure it out for yourself.”
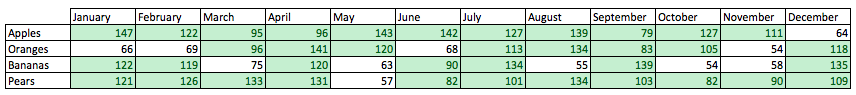
Conditional Formatting says this:
“Pears and Apples typically perform the best.”
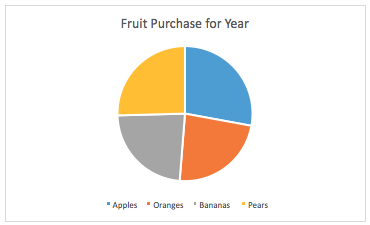
Graphs says this:
“Apples are the best by a slight margin.”
Where did your eyes go? My guess is it wasn’t Numbers response because it looks like a bunch of nonsense. Conditional Formatting helped a little, but Graphs helped you in a pinch.
Strategic Marketing Hinges on Digestible Data
While this is a pretty basic example, you can amplify it to how much data collection we do at SJ Marketing. See, rather than give you a bunch of data to swim through, we want to give you reporting that is clear and tells a story because, at the end of the day, that is why you hired us. We are consistently working harder to give you better reporting, and rolling out new ways to show results. Plus, reporting helps us figure out how to optimize your marketing spend and strategy by seeing trends and anomalies. So while we have years of experience, we do not strictly rely on hunches.
Therefore, if you need a helping hand combing through the endless streams of data and need some help with analysis, or if you want to talk about your football pool, this is why I am here with SJ Marketing, I’m the data nerd.
Click here to check out our company and all the ways we can help your business dig through big data.
— Julie Sabor, Account Coordinator